Harnessing the Power of Trading View: A Comprehensive Guide for Traders and Investors
In the fast-paced world of financial markets, having access to reliable, real-time charting tools can make all the difference between successful trading and missed opportunities. One platform that has revolutionized market analysis is trading view. Known for its sophisticated yet user-friendly interface, extensive technical analysis features, and vibrant community engagement, Trading View has become a go-to resource for traders and investors worldwide. Whether you’re a seasoned professional or a beginner just starting out, understanding how to effectively leverage Trading View can significantly enhance your market strategies and outcomes.
Understanding the Trading View Interface
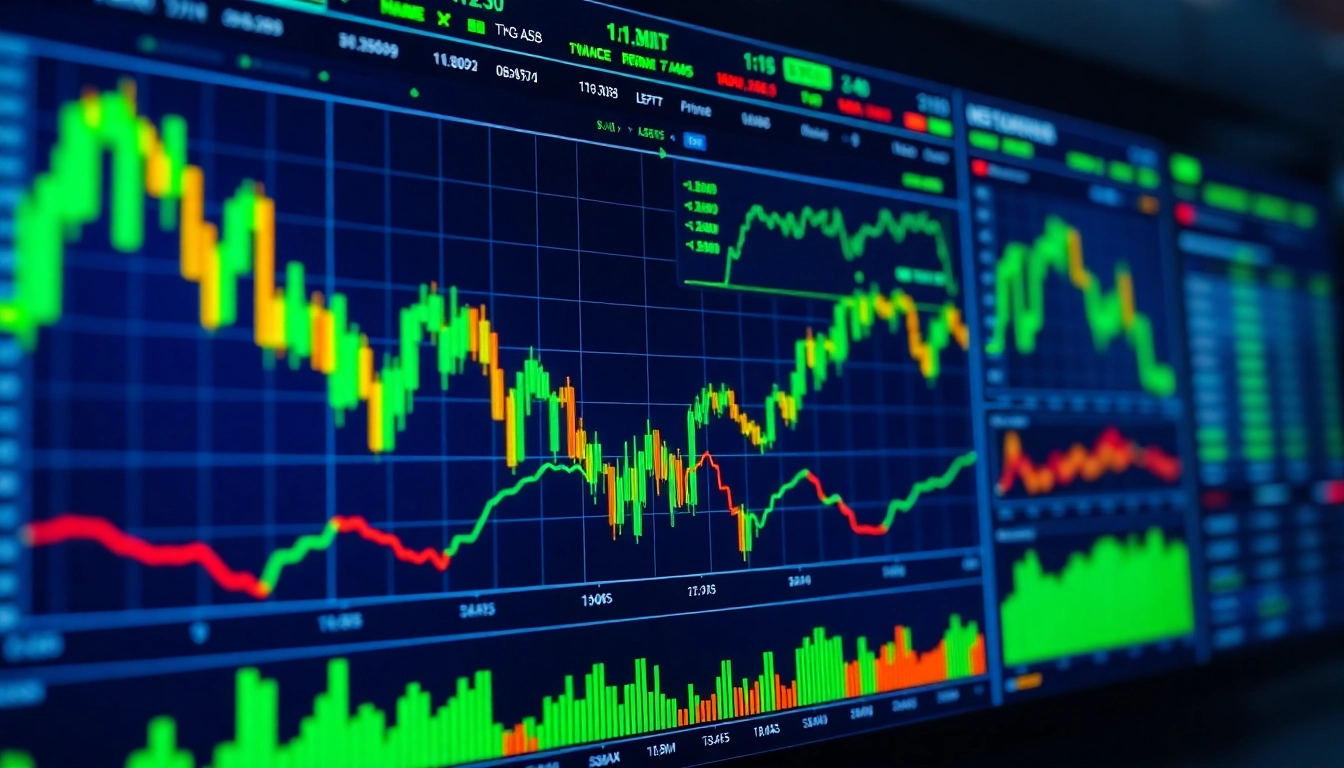
At the core of maximizing Trading View’s potential lies a clear understanding of its intuitive interface. The platform’s layout is designed to deliver a seamless experience, featuring multiple customizable chart windows, real-time data feeds, and versatile toolbar options. The main workspace revolves around interactive charts that support various chart types such as candlestick, line, bar, and Heikin-Ashi, each offering distinct insights into market trends.
Navigating through tabs and menus, traders can access essential functionalities, including drawing tools, technical indicators, and alert setups. The left sidebar holds annotation tools like trend lines, Fibonacci retracements, and support/resistance levels, allowing for precise technical analysis. The right sidebar typically displays your watchlist, alerts, and news feeds, keeping critical information at your fingertips.
To deepen your understanding, explore the platform directly, but remember that trading view offers tutorials and community forums that can help you master its features efficiently.
Customization is key. You can tailor the layout by saving chart templates, color schemes, and workspace setups, ensuring your workspace aligns with your trading style and reduces cognitive overload during high-volatility trading sessions.
Core Tools for Technical Analysis
Trading View’s extensive suite of technical analysis tools serves as the foundation for market prediction and decision-making. At the heart are hundreds of built-in indicators such as Moving Averages, RSI, MACD, Bollinger Bands, and Fibonacci levels. These tools facilitate a comprehensive view of price momentum, trend strength, market volatility, and potential reversal points.
Additionally, Trading View’s drawing tools enable precise marking of key price levels and chart patterns—head and shoulders, double tops/bottoms, triangles—that are crucial for pattern recognition. The platform’s ability to overlay multiple indicators and compare different timeframes supports multi-dimensional analyses.
A practical example includes combining RSI and Bollinger Bands to identify overbought or oversold conditions, thus reducing false signals. Advanced traders often utilize divergence detection between price and indicators to ascertain potential reversals before they unfold.
Mastering these tools requires consistent practice and understanding their application within your trading plan. Regular review of historical charts and backtesting can improve accuracy.
Setting Up Your Personalized Watchlist
An essential aspect of efficient trading is monitoring the right instruments without clutter. Trading View’s customizable watchlist feature allows traders to track a vast array of assets—from stocks and cryptocurrencies to indices and commodities—tailored to individual strategies.
Building a watchlist involves adding symbols, arranging them by priority, and setting personalized alerts for price movements, technical indicator thresholds, or news updates. This proactive approach ensures you stay informed about critical market shifts, enabling timely decision-making.
For example, a crypto trader might create a watchlist of top altcoins and set alerts for sudden volume spikes or price breakouts. The platform also allows grouping assets into folders, providing organizational flexibility for diverse trading strategies.
Regular updates and reviewing watchlists guarantee the focus remains on the most relevant market segments, which is vital during volatile periods.
Leveraging Trading View for Effective Market Trading
Using Real-Time Alerts and Notifications
One of Trading View’s standout features is its real-time alerts system. Alerts can be configured based on price levels, indicator conditions, or drawing tool triggers. When the specified condition is met, traders receive notifications via pop-ups, emails, or mobile app alerts, ensuring no critical movement goes unnoticed. This frees traders from constant screen watching, allowing for strategic flexibility.
Effective alert management involves setting multiple layers—short-term for quick trades and longer-term for portfolio monitoring—tailored to your trading horizon. For instance, setting an alert for a moving average crossover can signal entry or exit points with minimal delay.
Interpreting Advanced Chart Patterns
Recognizing chart patterns such as head and shoulders, triangles, flags, and channels enhances predictive accuracy. Trading View provides pattern recognition tools and visual aids that simplify identification, which can then be correlated with volume and indicator signals for confirmation.
For example, a descending triangle combined with declining volume might suggest a breakout to the downside. Understanding divergence patterns, where price action contradicts indicator signals, can also help anticipate reversals.
Integrating Trading Strategies with Trading View Tools
Successful trading hinges on strategy integration. Trading View’s flexible environment allows you to backtest strategies directly on historical data using its Pine Script programming language. This helps evaluate their robustness before live deployment. You can also develop custom indicators tailored to your unique approach.
Combining technical signals, volume analysis, and timing tools within a single platform streamlines decision-making and enhances confidence in trades. Regularly refining strategies based on backtesting results and real-time performance ensures continuous improvement.
Advanced Techniques for Trading View Users
Implementing Custom Indicators and Scripts
Trading View’s proprietary scripting language, Pine Script, empowers traders to create bespoke indicators, alerts, and strategies that align with their unique analysis methods. This flexibility allows you to automate complex calculations, visualize additional data layers, and optimize decision workflows.
Beginners should start by exploring existing scripts from the community, available through the Public Library, before tailoring or developing new indicators. For instance, custom oscillators or volatility filters can enhance signal clarity.
Utilizing Social Features for Market Insights
Trading View’s vibrant community is a treasure trove of ideas, analysis, and collaboration. Users can publish their ideas, follow leading analysts, and engage in discussions about market setups. This social dimension provides diverse perspectives and helps validate your analysis.
Engaging with community ideas, especially during high-impact events, offers insights into market sentiment and potential trade opportunities that may not be immediately apparent through technical analysis alone.
Backtesting Your Strategies for Accuracy
Backtesting enables traders to evaluate how their strategies would have performed historically. Trading View’s built-in backtesting environment supports testing strategies over different timeframes and markets. Assess key metrics like win rate, profit factor, and drawdowns to improve strategy robustness.
Consistent backtesting helps identify weaknesses and adapt strategies accordingly, leading to more disciplined trading and improved success rates.
Optimization and Performance Metrics for Trading View
Tracking Your Trading Performance Over Time
Long-term trading success depends on meticulous performance tracking. Trading View’s portfolio feature allows traders to monitor open and closed trades, analyze profit/loss, and review performance metrics over different periods.
Regularly reviewing these metrics helps identify patterns—such as recurring losses or high-performing setups—and refine tactics.
Analyzing Indicator Effectiveness
Not all indicators are equally effective across different assets or timeframes. Maintaining a performance log of indicator signals and their outcomes can provide data-driven insights into their predictive value. Adjust or replace underperforming indicators based on empirical evidence.
Refining Your Trading Plan Based on Data Insights
The culmination of tracking and analysis is continuous strategy refinement. Use data insights to set realistic goals, adjust entry and exit criteria, and manage risk parameters. Backtested and performance-based modifications lead to more consistent trading results.
Future Trends and Innovations in Trading View
The Impact of AI Integration in Chart Analysis
As artificial intelligence becomes more sophisticated, integration within platforms like Trading View is set to revolutionize market analysis. AI-powered pattern recognition, predictive modeling, and sentiment analysis will enable traders to anticipate moves with higher accuracy and speed.
Emerging Features for Traders and Investors
Future updates may include enhanced automation capabilities, more comprehensive social trading functions, and deeper integration with brokerage accounts for seamless execution. Interactive tutorials, personalized learning aids, and augmented reality overlays are also expected innovations.
Community-Driven Developments and Collaborations
The strength of Trading View lies in its community. User-driven feature requests, collaborative code sharing, and marketplace integrations foster a dynamic environment where traders co-create tools and ideas continuously.
Staying engaged with community forums and beta programs will be crucial for early adoption of these innovations.